
Linear Equation

linear equation simulations
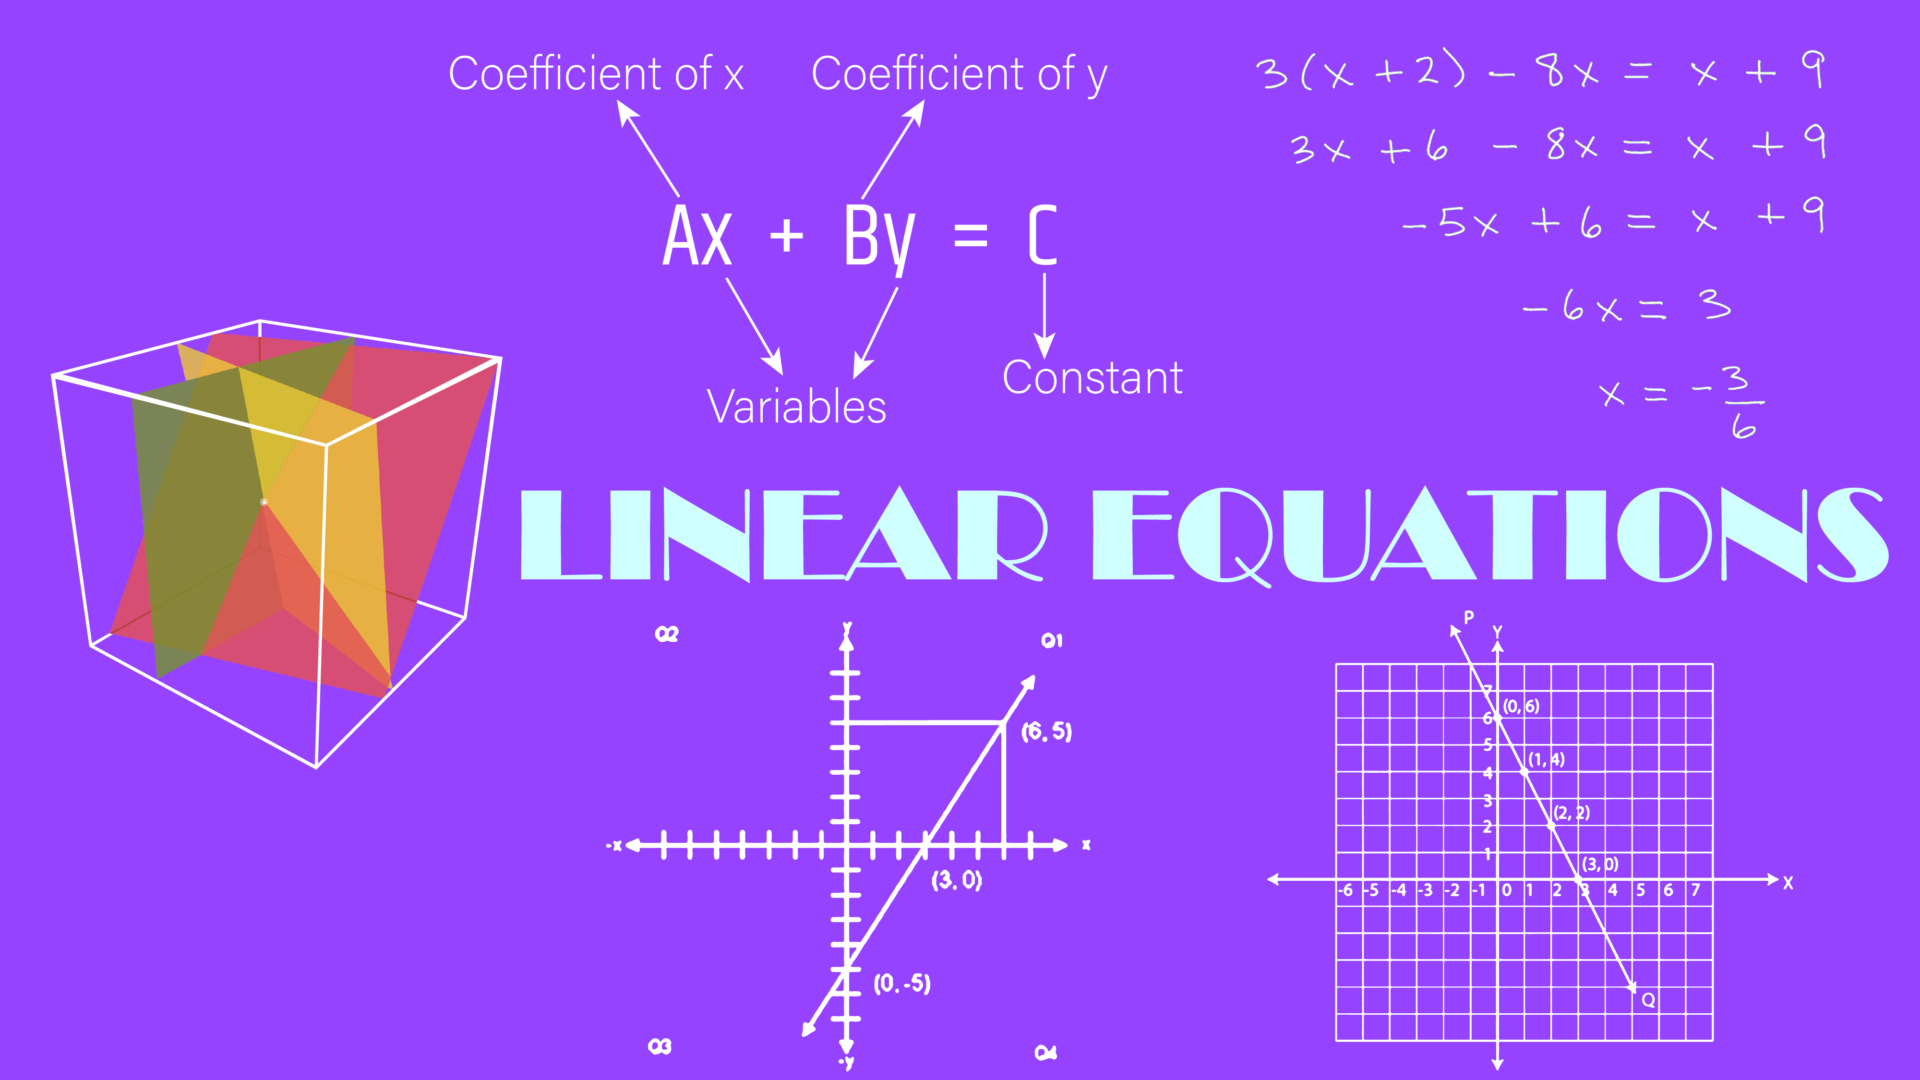
What is a Linear Equation?
A linear equation is an algebraic equation in which each term is either a constant or the product of a constant and a single variable. The equation represents a straight line when plotted on a graph. The most common form of a linear equation in two variables is:
Y = mx + C
Where:
- y is the dependent variable (the output).
- x is the independent variable (the input).
- m is the slope of the line (it indicates how steep the line is).
- c is the y-intercept (the point where the line crosses the y-axis).
Understanding Variables!
In mathematics, variables are symbols used to represent unknown values. They allow us to create general rules and formulas that can be applied to various situations. In the context of linear equations:
- The independent variable (often denoted as x) is the one you control or change.
- The dependent variable (often denoted as y) changes in response to the independent variable.
For example, in a situation where you are calculating how much money you earn based on the number of hours you work:
- x could represent the number of hours you work.
- y could represent the amount of money you earn.
If you earn 100 rs. per hour, the relationship can be expressed as a linear equation:
Y = 100x
Here, the slope m is 100, indicating that for each additional hour worked, you earn rs100 more.
Components of a Linear Equation – “Y = mx + C”
Slope (m): The slope is a measure of how much y changes for a unit change in x. If the slope is positive, the line goes upwards as it moves from left to right. If it’s negative, the line slopes downwards. If the slope is zero, the line is horizontal, indicating that y does not change as x changes.
- For example, if m = 2 then for every 1 unit increase in x, y increases by 2 units.
Y-intercept (c): The y-intercept is the value of y when x is zero. It’s the point where the line crosses the y-axis. This tells you the starting value of y when no changes in x have occurred.
- For example, in equation Y = 2x + 3 the y-intercept is 3, meaning the line crosses the y-axis at the point (0,3).
Forms of Linear Equations:
Linear equations can be written in different forms, each useful in different scenarios:
Standard Form: ax + by = c
This form is useful when dealing with equations that include both x and y terms on the same side.
Slope-Intercept Form: y = mx + c
This is the most common form and is especially useful when you need to quickly identify the slope and y-intercept.
Solving Linear Equations:
To solve a linear equation means to find the value of the variable that makes the equation true. Let’s explore this with a couple of examples:
Example 1: Single Variable 3x + 5 = 20
Steps to solve:
- Subtract 5 from both sides: 3 x = 15
- Divide both sides by 3: x = 5
Example 2: Two Variables 2x + 3y = 12
To solve for one variable, you need additional information, such as the value of one variable or a second equation.
Example 3: System of Equations
Consider the following system of linear equations:
- 2x + 3y = 6
- x − y = 2
There are several methods to solve this system:
- Substitution Method: Solve one equation for one variable, then substitute that into the other equation.
- Elimination Method: Add or subtract the equations to eliminate one variable, making it easier to solve for the other.
- Graphical Method: Plot both equations on a graph; the point where they intersect is the solution.
Graphing Linear Equations
When graphing a linear equation, the goal is to plot points that satisfy the equation and then draw a line through those points.
Example: Graph the equation y = 2x + 1
Find the y-intercept: When x=0, y=1, so one point is (0, 1).
Use the slope: The slope is 2, meaning for every 1 unit increase in x, y increases by 2 units. From (0, 1), move 1 unit right and 2 units up to plot another point at (1, 3).
Draw the line: Connect the points (0, 1) and (1, 3) with a straight line.
Real life applications
Linear equations are incredibly useful in everyday life. Here are a few examples:
- Business: Companies use linear equations to calculate profit, where profit is based on the number of items sold (x) and the profit per item (m). For example, if a company makes rs.5 profit per item, the equation y = 5x + 1000 can represent total profit, where 1000 is a fixed cost.
- Science: In physics, linear equations describe motion, such as the relationship between speed, distance, and time. For example, if a car travels at 60 km/h, the equation d = 60t (where d is distance and t is time) represents the distance traveled over time.
- Budgeting: If you want to save money, you might use a linear equation to represent your savings over time. For example, if you save rs.500 each month, the equation y = 500x can predict your total savings y after x months.


Responses